Where this fits: The last chapter explained how mutual funds work. This chapter helps you choose among the several hundred available.
By the end of this chapter you will be able to
- Navigate the main categories of mutual fund and match them to your goals
- Read a Risk-o-meter and know where to find a scheme’s real details
- Interpret a return figure correctly and avoid the most common selection errors
Start with the goal, not the fund
There are hundreds of mutual fund schemes in India. Choosing among them by looking at last year’s return table is how most people do it, and it is close to the worst available method.
The right sequence is:
- The goal and its horizon
- The asset class that suits that horizon
- The category of fund within that asset class
- The scheme within that category
By the time you reach step 4, most of the decision is already made, and the remaining choice matters much less than people imagine. A person who correctly determines “I need an equity fund for a fifteen-year goal” and then picks a reasonable diversified fund will do far better than someone who picks last year’s top performer without knowing why they are buying equity at all.
The categories
SEBI has standardised mutual fund categories so that schemes with the same label do broadly the same thing across fund houses. Here is the map.
By structure
Open-ended: You can buy or redeem units at any time, at the prevailing NAV. No fixed maturity. Most schemes are open-ended, and this is what most investors should use.
Close-ended: Launched for a fixed tenure. You can invest only during the New Fund Offer period; afterwards, exit before maturity generally requires selling on the stock exchange where the scheme is listed, often at a discount to NAV.
Interval: A hybrid of the two — transactions permitted only during specified intervals announced in advance.
By Asset Class
Equity funds invest mainly in shares. Aim for long-term capital appreciation. Higher risk, higher long-term potential. Suited to long horizons.
Debt funds invest in fixed-income instruments — government securities, treasury bills, corporate bonds, money market instruments. Generally lower risk than equity, aiming for relatively stable returns. Note “lower,” not “no” — interest rate risk and credit risk both apply, and both are explained later.
Hybrid funds hold a mix of equity and debt, aiming to balance risk and return. Useful for medium-horizon goals and for investors uncomfortable with pure equity.
Multi-asset funds invest in at least three asset classes — typically equity, debt and gold. Broader diversification in a single scheme.
By market capitalisation (equity funds)
Large-cap funds invest primarily in large, established companies. Generally the least volatile equity category.
Mid-cap funds invest in medium-sized companies with growth potential. Higher return potential, higher volatility.
Small-cap funds invest in smaller companies. Highest long-term potential and by far the highest volatility. Falls of 40% or more in bad periods are not unusual. Suitable only as a small part of a portfolio, for a long horizon, for someone who genuinely will not panic.
Flexi-cap funds invest across large, mid and small caps without a fixed allocation, leaving the manager free to shift with conditions.
By management style
Active funds are managed by a fund manager who selects securities with the aim of beating a benchmark index. Requires continuous research, and therefore carries higher expenses. Performance depends on the manager’s skill and decisions.
Passive funds track an index — Nifty 50, Sensex, or another — holding the same securities in nearly the same proportion. Minimal manager involvement, therefore much lower expenses. The objective is to match the index, not beat it. Exchange Traded Funds (ETFs) also fall into the Passive fund category.
The active-versus-passive question is genuinely debated. The case for passive is that costs are certain while outperformance is not, and that over long periods a substantial proportion of active funds fail to beat their benchmark after costs. The case for active is that skilled managers do exist and that some segments of the market offer more scope for skill. For a beginner, a low-cost broad index fund is a defensible core holding that removes an entire category of decision.
By speciality
Sectoral funds invest in one sector — banking, pharmaceuticals, technology, infrastructure. Concentrated, therefore high risk. They also tend to be launched and marketed after a sector has already performed well, which is precisely when future returns are least attractive.
Thematic funds invest around a theme — manufacturing, consumption, ESG, digitalisation — potentially across several sectors. Broader than sectoral, still concentrated.
Exchange Traded Funds (ETFs) track an index or commodity and trade on the exchange like a share. Very low expense ratios. Require a demat account, and you buy at the market price, which can differ slightly from NAV.
Fund of Funds (FoF) invest in other mutual funds or ETFs rather than directly in securities. Convenient, but you bear expenses at two levels.
Life Cycle Funds are built around a target maturity year and a glide path: the scheme holds more equity while that year is distant and shifts progressively towards debt as it approaches, inside the same scheme. They replaced the former solution-oriented category — retirement funds and children’s funds — under SEBI’s categorisation review of February 2026. SEBI found that solution-oriented schemes often held portfolios barely distinguishable from ordinary equity or hybrid funds while carrying goal-based branding and a lock-in, so the category was discontinued: existing schemes stopped accepting fresh subscriptions and are to be merged into schemes of similar asset allocation and risk, subject to SEBI’s approval. If you already hold one, your existing units are unaffected until that merger; read the notice your AMC sends and check what your scheme is being merged into.
The factsheet: where the answers actually are
Every scheme publishes a monthly factsheet — a two- or three-page summary that fund houses are required to produce and update. It is free, it is on the AMC’s website, and it contains almost everything the previous pages told you to check. Most investors have never opened one.
What to look for, and why:
| On the factsheet | What it tells you |
|---|---|
| Investment objective and category | Whether the scheme is doing what its name suggests — the “true to label” test |
| Total Expense Ratio, Direct and Regular | What you are paying each year, and what the distributor arrangement costs you |
| Assets under management | The size of the scheme, which affects how nimble it can be |
| Portfolio holdings and top ten | What you actually own, and whether it overlaps heavily with your other funds |
| Sector and asset allocation | Where the concentration sits, and whether it matches what you intended |
| Benchmark and returns against it | Whether the manager has added anything over a plain index, over meaningful periods |
| Riskometer | The scheme’s risk level on SEBI’s prescribed scale, reviewed monthly |
| Fund manager and tenure | Who is running it, and for how long — a record under a manager who left tells you little |
| Exit load and minimum investment | What leaving early costs, and what it takes to start |
| On the factsheet | What it tells you |
| Portfolio turnover ratio | How much the manager trades, which drives transaction costs inside the TER |
Two habits make the factsheet genuinely useful rather than merely available.
- Compare the same month across schemes: Factsheets are dated. Comparing March for one fund against September for another compares two different markets, not two different funds.
- Read the portfolio, not only the return: Two funds with similar returns can hold entirely different things. If your three equity funds share most of their top ten holdings, you own one fund three times and are paying three management fees for it.
The factsheet is also the honest answer to "how do I research a fund?" You do not need a subscription service or a ranking website. The regulator already requires the fund to publish what you need, in a standard form, every month.
Debt fund categories
Debt funds are categorised largely by the maturity of what they hold, which determines their sensitivity to interest rate changes.
| Category | Typical holdings | Best suited for |
|---|---|---|
| Liquid funds | Instruments maturing up to 91 days | Parking money for days or weeks; emergency fund component |
| Ultra-short duration | Very short maturities | Money needed within a few months |
| Money market funds | Treasury bills, commercial paper, certificates of deposit | Short-term parking with low risk |
| Short duration funds | Shorter-maturity debt | Horizons of roughly one to three years |
| Long duration funds | Longer-maturity debt | Long horizons; benefit when rates fall, fall when rates rise |
| Gilt funds | Government securities only | No credit risk, but full interest rate sensitivity |
| Floating rate funds | Debt with periodically resetting rates | Reducing the impact of rising rates |
| Corporate bond funds | Higher-rated corporate debt | Slightly higher yield than gilts, with some credit risk |
The general rule: the longer the maturity of what a debt fund holds, the more its NAV moves when interest rates change. A liquid fund barely moves. A long duration gilt fund can move substantially.
The Risk-o-meter
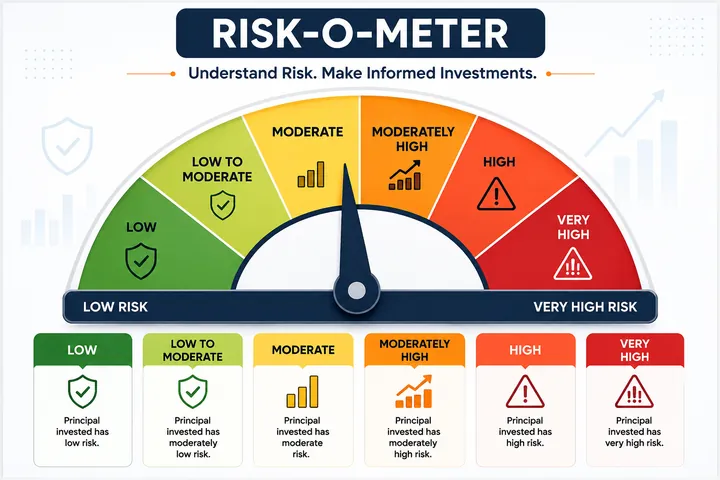
Every mutual fund scheme must display a Risk-o-meter — a standardised dial showing the scheme’s risk level, calculated by a prescribed methodology and updated monthly.
It has six levels:
| Level | Broadly indicates |
|---|---|
| Low | Overnight and liquid-type schemes |
| Low to Moderate | Very short duration debt |
| Moderate | Short to medium duration debt, some conservative hybrids |
| Moderately High | Longer duration debt, balanced hybrids |
| High | Large-cap equity, aggressive hybrids |
| Very High | Mid-cap, small-cap, sectoral and thematic equity |
Two things to note. The Risk-o-meter is updated monthly and can change as the portfolio changes — a fund you bought at “Moderate” may not still be there. And it measures the scheme’s risk, not its suitability for you; a “Very High” scheme is not wrong, it is simply wrong for a two year goal.
Where the real information is
Marketing material is not the scheme. Three documents are.
Scheme Information Document (SID)
The detailed document for a scheme. It sets out:
- The investment objective and where the scheme will invest
- Asset allocation limits — the minimum and maximum in each asset type
- Risk factors specific to the scheme
- The benchmark index against which performance is measured
- Fees, expenses and load structure
- Details of the fund manager
- Redemption process and timelines
If you read one document before investing, read the objective, the asset allocation table and the risk factors in the SID. It takes ten minutes and tells you what the scheme is actually permitted to do — which is sometimes materially different from what its name suggests.
Statement of Additional Information (SAI)
Contains statutory and legal information about the mutual fund and the AMC — constitution, trustees, key personnel, penalties and pending litigation. Read it if you want to understand the institution behind the scheme.
Key Information Memorandum (KIM)
A condensed summary of the SID, provided with the application form. Useful, but it is an abridgement — the full detail is in the SID.
All three are available on the AMC’s website and must be provided on request.
Reading returns correctly
Return figures are presented in several ways, and they are not interchangeable.
Absolute return is the simple percentage change from purchase to today, ignoring time. ₹1,00,000 becoming ₹1,60,000 is a 60% absolute return — whether that took two years or twelve. Useful only for periods under a year.
Compound Annual Growth Rate (CAGR) is the annualised rate that would take you from the starting value to the ending value over the period. It is the correct measure for comparing periods longer than a year. ₹1,00,000 becoming ₹1,60,000 over five years is a CAGR of about
9.9% — a very different impression from “60%.”
Trailing returns show the return over a period ending today: 1-year, 3-year, 5-year. They are the most commonly quoted and the most misleading, because they depend entirely on the end date. A fund can look outstanding on a 3-year trailing basis simply because three years ago happened to be a market bottom.
Rolling returns compute the return over every possible window of a given length within a period — every three-year period, rolled daily or monthly. This shows consistency rather than a single lucky window, and it is much more informative than trailing returns. If you are able to look at only one return measure, make it this one.
Watch Out — the four commonest selection mistakes
Buying last year’s top performer. The top of one year’s table is frequently in the bottom half of the next. Sector and style leadership rotates. Past performance genuinely does not indicate future returns, and the disclaimer means what it says.
Buying a New Fund Offer because it is ₹10. A new scheme has no track record. The ₹10 price is arbitrary. There is no discount.
Owning too many schemes. Eight equity funds usually means owning the same thirty companies eight times, with eight expense ratios and eight sets of paperwork. Three to five wellchosen schemes across asset classes is enough for almost any household.
Judging a fund over one year. An equity fund should be judged over at least a full market cycle — five years or more. Redeeming after one bad year converts a temporary decline into a permanent loss, and it is the single most expensive habit in retail investing.
A practical selection process
- Confirm the goal and horizon.
- Pick the asset class.
- Pick the category within it — for a fifteen-year goal, a diversified equity or index fund; for three years, a hybrid or short duration debt fund.
- Shortlist three or four schemes in that category from established fund houses.
- Compare: rolling returns against the benchmark over five years or more, TER, portfolio concentration, fund manager tenure, and consistency during past falls.
- Read the SID — objective, asset allocation, risk factors.
- Check the Risk-o-meter against your risk tolerance.
- Invest, and give it at least five years before judging.
Recap in one minute
- Choose in this order: goal, asset class, category, scheme. Most of the decision is made before you look at any scheme.
- Categories are standardised by SEBI, so the same label means broadly the same thing across fund houses.
- The Risk-o-meter has six levels, is updated monthly, and measures the scheme’s risk, not its suitability for you.
- The SID contains the objective, asset allocation limits and risk factors. Read it.
- Use CAGR for multi-year comparison and rolling returns for consistency. Trailing returns flatter whoever is quoting them.
Check your understanding
Money you need in eight months — which fund category, and which would be clearly wrong?
Show answer to question 1
A liquid or ultra-short duration fund, or a short FD. An equity fund would be clearly wrong — eight months cannot absorb a market fall.A fund turned ₹1,00,000 into ₹2,00,000 in seven years. Roughly what is the CAGR? (Rule of 72 will get you close.)
Show answer to question 2
Doubling took 7 years, so roughly 10% (72 ÷ 7 ≈ 10.3%).Why are rolling returns more informative than trailing returns?
Show answer to question 3
Because rolling returns compute the return over every possible window of a given length, showing consistency. Trailing returns depend entirely on the end date and can be flattered by a favourable starting point.
Your action step
Take one goal from your goal table. Work through the eight-step selection process for it, and read the SID of your shortlisted scheme — genuinely read the objective, asset allocation and risk factors. Note down anything that surprised you.